
WIF’s uptrend now appears to be weakening, with the Relative Strength Index (RSI) and Average Directional Index (ADX) indicators showing a decrease in trend strength. Investors are therefore advised to proceed with caution.
RSI points to a reversal in WIF
WIF’s RSI is currently 45.34, down from 74 on October 7th. This decline suggests that buying momentum has weakened significantly as fewer investors have entered the dogwifhat market at current levels.
We remind you that the RSI (Relative Strength Index) measures the speed and variation of an asset’s price movements, which allows you to find out whether it is overbought or oversold. Its value is between 0 and 100. Values above 70 indicate an overbought situation that may lead to a pullback, and values below 30 indicate an oversold situation that may be a sign of a selling opportunity.
Go further: How to read a cryptographic chart?
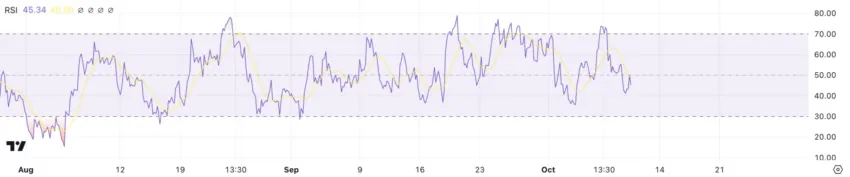
So the RSI of 45.34 tells us that WIF is approaching neutral territory after being overbought. This level suggests that buying pressure is easing and the market may be entering a consolidation phase.
Although the price of the same coin remains in an uptrend, this recent drop in the RSI could therefore indicate a potential reversal if buying momentum does not resume. If this downtrend were to continue, the price of WIF could lose its upward momentum, leading to increased selling pressure and a possible downside. Traders should therefore watch for further bearish signals to anticipate further market movement.
A weakening trend
The ADX WIF is currently at 18.73, down from 53 on October 1st. This decline indicates that the strength of the current trend has weakened significantly, indicating a loss of momentum in the recent uptrend in price.
The ADX index (from the English Average Directional Index) makes it possible to quantify the strength of the trend, whether bullish or bearish. It ranges from 0 to 100, with values above 25 generally considered to indicate a strong trend, while values below 20 indicate a weak or no trend.
Therefore, the dramatic drop in ADX dofwifhat indicates that the previously strong uptrend in WIF is weakening and market participants are losing confidence. This decline in trend strength can then lead to some uncertainty as the market tries to decide on a clear direction.
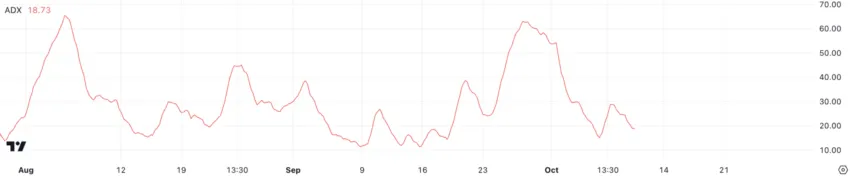
While WIF is technically still in an uptrend, its current ADX value of around 18 suggests that the trend is not strong enough to support further growth without renewed interest in buying the same corner. Therefore, a low ADX value means that the price of WIF lacks a defined direction and could be subject to high volatility.
In this context, traders need to be cautious because the absence of strong dynamics makes it impossible to predict whether the price will continue to rise or reverse and instead enter a bearish trend. In the absence of a clear directional flow, WIF price movement can be erratic and a reversal is possible if current conditions persist.
To go further: The same coins to watch in October 2024
WIF price prediction: potential correction
WIF has soared 42% over the past month, becoming the top performing coin among the top five tokens in the category. It has now become the most important meme coin in the Solana network. WIF’s market capitalization is currently more than 60% higher than that of its closest competitor, BONK.
After such a significant increase in the price of an asset, it is natural for a correction to occur as traders take profits and buying momentum slows. Currently, the WIF EMA lines are still in a bullish pattern, with the short-term EMAs positioned above the long-term EMAs. However, the short-term lines have started to decline since yesterday, which could indicate a potential reversal.
As a reminder, exponential moving average (EMA) lines are a type of moving average that puts more emphasis on current asset price data, making them more responsive to short-term movements. They are often used to identify trends and potential reversals in an asset’s price movement.
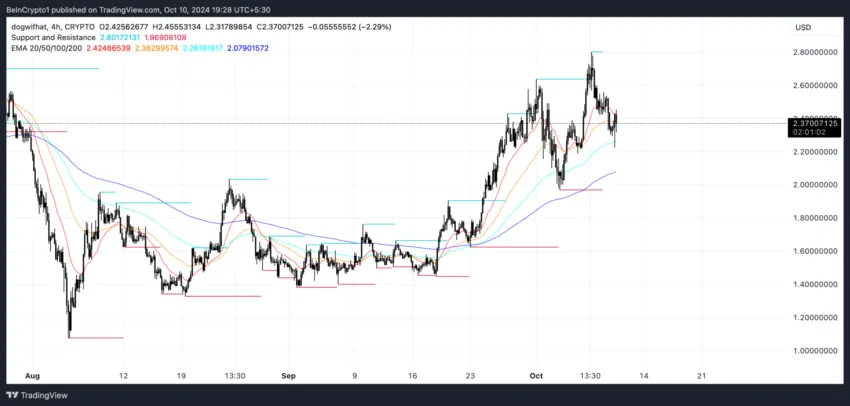
If there is a reversal, the price of WIF could soon test the support level at $1.62. This would be a key point for traders to watch to see if the trend continues down or stabilizes. However, if the uptrend regains strength, WIF is likely to test the resistance levels around $2.63 and $2.8.
A price break above these resistance levels could then trigger a new rally, potentially pushing WIF towards the $3 zone – a price it hasn’t reached since June 2024. The market’s reaction to these key levels will then determine whether the same coin can sustain its bullish run. momentum or if it enters a correction phase.
Moral of the story: The same corner knows no stability.
Disclaimer
Disclaimer: In accordance with The Trust Project guidelines, BeInCrypto is committed to providing unbiased and transparent information. This article aims to provide accurate and relevant information. However, readers are encouraged to check the facts for themselves and seek professional advice before making any decisions based on this content.